
Using Comet Panels for Computer Vision at Pento.ai
 Intro by Niko Laskaris
We released a code-based custom visualization builder called Custom Panels. As part of the rollout, we’re featuring user stories from some of the awesome researchers using Comet as part of their research and development toolkit. One of these teams, Pento.ai, are long-time Comet users and were part of the beta test group for Custom Panels. Pento is a top machine learning consulting firm working with some of the biggest companies in the world. We were excited to see what they’d come up with given the freedom to build any visualization they wanted, and we weren’t disappointed.

Comet Custom Panels at Pento.ai
Written by Pablo Soto and Agustin Azzinnari
Pento is a company specializing in building software solutions that leverage the power of machine learning. By incorporating data and learning into our clients’ processes, we help them make optimal decisions or even automate entire processes.
There are many consulting companies out there all with a similar offering so, since the beginning, we’ve tried to take a novel approach. Pento is composed of a group of partners that have ample experience in the industry, delivering solutions with real and measurable results.
Having this autonomy allows us to cover a lot of ground while being highly specialized: we are partners with a proven track record in computer vision, in predictive analytics, as well as natural language processing. We’ve also been able to let this focus spill over to the open source community we leverage so much from, by contributing with tools such as our human perception library, Terran.
In today’s job market, machine learning development is a highly sought-after skill. Many companies are popping up left and right to fill this gap left by the new advances in the area. However, not every ML project goes according to plan. There are many, many aspects one needs to balance at the same time.
As such, ML engineers need to make use of all the tools at hand to ensure this process goes smoothly. We’ve found Comet, in particular, to be one of the tools that have permanently found a place in our toolbox.
Being organized and clear when delivering results is one of the key points to a successful ML initiative. If the series of steps one takes in order to make an automated decision isn’t clear, or simply if the client doesn’t understand the results presented, the project is bound to fail.
Due to this, it’s crucial to keep track of all your experiments, to understand and preserve a record of all of your research over the course of a project. If these experiments take hours or even days to run, we’ll forget why we ran them in the first place. Here’s where we’ve found tools such as Comet to be extremely useful: centralize data for all experiments, attach all the metadata we need to them, visualize intermediate results, and be able to quickly reproduce them.
Working with one client after another, we end up re-using the same visualizations and analytical tools over and over, leveraging the experience acquired in one project for the next one. Given that machine learning is an incremental process, we are constantly tweaking our code and systems and carrying them over to our next project. The Custom Panels feature in Comet is a step towards perfecting that re-usability.
Good visualizations are key to any successful ML project, but this is especially true for Computer Vision (CV) projects. In the following section, we will present a simple CV project, and explore how we can use Comet to improve our experimentation process. We’ll be using our open-source human perception library, called Terran, in order to illustrate the process we’d normally do in a real project.
What’s Terran?

Terran is a human perception library that provides computer vision techniques and algorithms in order to facilitate building systems that interact with people. Whether it’s recognizing somebody by their face, or detecting when they raise their hand, Terran provides the primitives necessary to act in response to a person.
Building a Panel
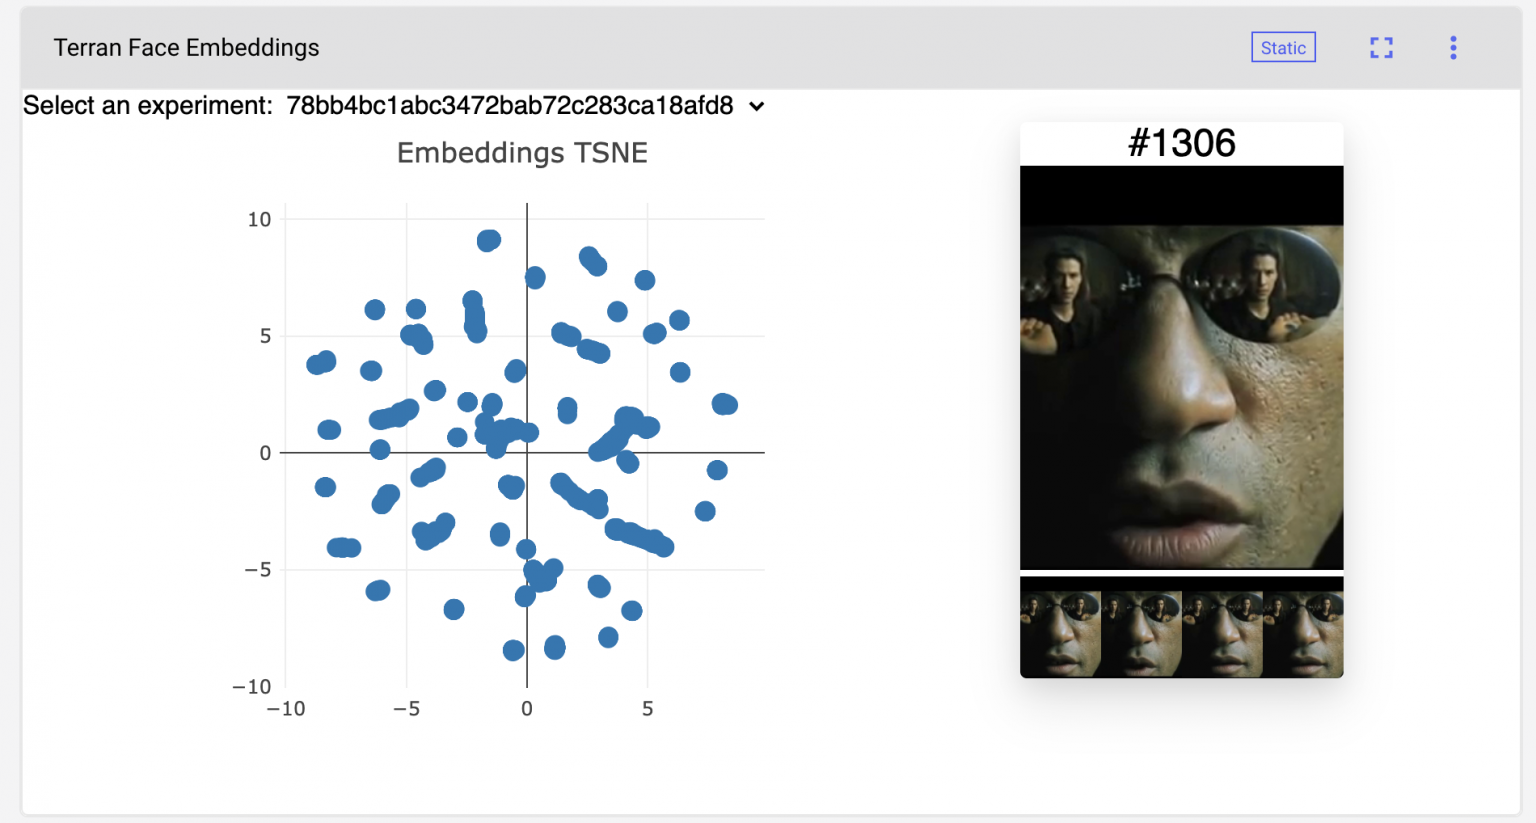
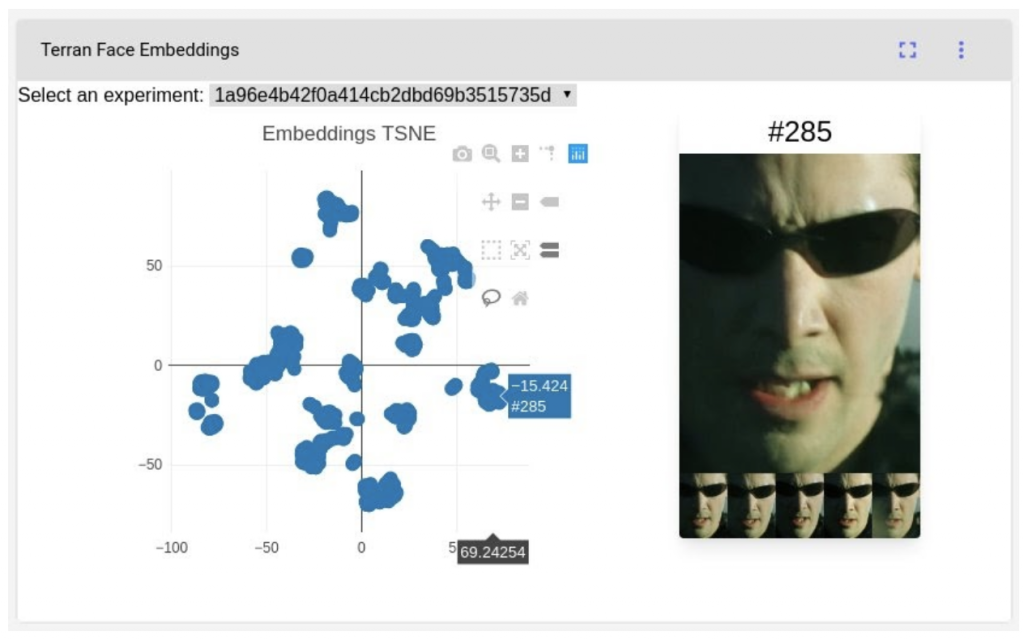
The example project will consist of a simple program that detects faces in a video. In order to do this, we’ll be using three key functionalities from Terran: face detection, recognition and tracking. We’ll implement a custom visualization that’ll help us understand how our program is performing. A common technique to do this is to plot the face embeddings generated by Terran as points on a plane to see if these points are reasonably structured.
For instance, we might train an image classifier, embed these internal representations into a 2-dimensional space, and check that images of the same classes are embedded in nearby regions of this resulting space. If this assumption doesn’t hold, it’s possible our samples are under-represented or even mislabeled, or that there’s an issue with our classifier, so it’s a good thing to check every once in a while.
In our example, we are going to generate the proposed embedding visualizations using the results of our face detection and recognition, and then make sure that faces corresponding to the same person are indeed placed nearby. Here is the video we’ll be using:
First, let’s go with the traditional, fully Python, approach:
We perform face detection and feature extraction on each frame of the video using Terran, which is as simple as using the face_tracking and extract_features functions. By feature extraction we mean retrieving a 1024-dimensional representation for each face, where faces that are similar (and thus probably correspond to the same person) have a small cosine distance between them.
from terran.io import open_video
from terran.face import Detection, extract_features
from terran.tracking import face_tracking
video = open_video(
    'https://www.youtube.com/watch?v=ggFKLxAQBbc',
    batch_size=64
)
tracker = face_tracking(
    video=video,
    detector=Detection(short_side=832),
)
faces = []
 features = []
 for frames in video:
     faces_per_frame = tracker(frames)
     features_per_frame = extract_features(frames, faces_per_frame)
for frame, frame_faces, frame_features in zip(
    frames, faces_per_frame, features_per_frame
):

    for face, feature in zip(frame_faces, frame_features):
     face_crop = crop_expanded_pad(
            frame, face['bbox'], factor=0.0
        )

        faces.append(face_crop)
        features.append(feature)
Perform dimensionality reduction over these representations by using t-SNE:
from sklearn.manifold import TSNE

reduced = TSNE(
    n_components=2,
perplexity=20.0,
n_iter=5000,
metric='cosine',
n_jobs=-1
).fit_transform(embeddings)
And finally, use the TSNE results to get closest neighbors to each points:
from scipy.spatial.distance import cdist
k = 5
d = cdist(reduced, reduced)
neighbors = d.argsort(axis=1)[:, 1: k+1]
Even though Python visualizations can be helpful, they are still static, which makes it difficult to navigate through the results without re-running it each time with different values. Even more, it’s really hard to keep track of the visualizations for each experiment, especially if we have to manually generate them on every run. All of this makes the experimentation process slow and error-prone.
Fortunately, Comet has found a solution for this with Comet Panels. By providing a flexible interface they allow us to create custom interactive visualizations that integrate seamlessly with the rest of Comet’s features, such as asset logging and experiment comparisons.
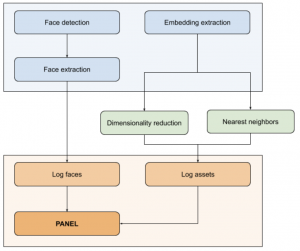
Extending our example above to use Panels is simple. The following diagram shows how everything fits together. So far we have implemented the blue and green boxes. Now we need to implement the Comet integration (orange).
The first thing we need to do is to upload all the data required by the visualizations. In our case, it means uploading the face crops from step 2 and the face embeddings from step 4 (that is, the 2-dimensional embeddings, so we use up less storage).
We’ll do this from within our Python training code, following the usual steps we go through when using Comet:
1. We first create the experiment:
experiment = Experiment(‘API-KEY’)
2. Then log the necessary assets. First the face crops:
for face_name, face in enumerate(faces):
experiment.log_image(face, name=face_name)
3. Then the embeddings and the pre-calculated neighbors data
data = dict(
x=reduced[:, 0].tolist(),
y=reduced[:, 1].tolist(),
faces=[f'#{face_id}' for face_id in range(len(faces))],
neighbors=neighbors.tolist()
)

experiment.log_asset_data(data, name='tsne.json')
Now that we have the data available in Comet, we need to build the Panel. The basic interface to be implemented by our Panel is the following:
class MyPanel extends Comet.Panel {
  setup() {
 // Configuration.
  }
  draw(experimentKeys, projectId) {
	// Select experiment.
	this.drawOne(selectedExperimentKey);
  }
  drawOne(experimentKey) {
	// Create and initialize the chart.
  }
}
The setup method is a good place to define all the configurations for your panel. In our case we defined some options for our Plotly chart:
setup() {
  this.options = {
	layout: {
	  	showlegend: false,
  		legend: {
	    		orientation: "h"
	  	},
  		title: {
	    		text: "Embeddings TSNE"
	  	}
	}
  };
}
Our Panel only works to visualize data from a single experiment, therefore we need to apply the approach described here. For the draw method, we select the experiment we want to explore, while in the drawOne method, we create the actual plot. In order to build the plot, we need to fetch the data we uploaded to Comet by using the Javascript SDK:
drawOne(experimentKey) {
  // Instantiate Plotly chart.
  // Fetch face images.
  this.api.experimentImages(experimentKey)
	.then(images => {
  		// Fetch tSNE coordinates and nearest neighbors data.
  		this.api.experimentAssetByName(experimentKey, "tsne.json")
	    	.then(result => {
      		// Draw points in chart.
    		});
	});
}
Once we have the data we need in the panel, we can make use of all the Javascript, HTML and CSS ecosystem to create our custom visualization.
To view our custom panel, check out our public Comet project here.
Conclusion
Machine learning is a new addition to software engineering. A whole new set of difficulties and possibilities arise. However, just like the software industry was still searching for ways to tackle projects in a more principled manner at the end of the last century, so as to make the whole process less uncertain, it is now searching for better ways to incorporate ML into the development process.
Part of this evolution is done by making practices more robust and reproducible, and tools such as CometML are contributing towards that goal. As practitioners, we very much welcome such initiatives.